

As an early-stage entrepreneur, I don’t have the luxury of tracking every metric I would like to. What makes customer retention such an important metric, and how should I track it?
Sincerely,
Drowning in Data
This is a great question! My colleague James Kim has been working intensively on analyzing retention data for our portfolio and pipeline companies and has great insights into this topic. I asked him to please answer your question. Enjoy!
— Esteban
Dear Drowning,
Retention is the lifeblood of any business. As the go-to measure of repeat business, i.e. dollars spent within a certain period of time following a customer’s first spend, retention is a key driver of customer lifetime value (LTV). LTV is a critical metric that captures how much value a customer brings your company during their tenure as a customer. More fundamentally, retention is a measure of product-market fit: all else equal, the longer a paying customer sticks around, the more benefit we can assume they are deriving from your product.
(Note: In this post I use “retention” synonymously with paid retention, but retention can generally refer to any key action, e.g. opening an app or sharing a piece of content, taken within a certain period of time following sign-up.)
Retention is especially critical to edtech companies, which often address a narrow slice of a learner’s life. For example, in the Reach portfolio, Lovevery currently offers subscription boxes for babies and toddlers aged 0–2; Epic!’s e-book library is tailored to kids under 12; Frank delivers financial aid products to students in high school and college. Because these customers have a natural “expiration date,” it is imperative to understand their behavior and retain them at high rates during the time when they fall within the target demographic.
Suffice it to say, having a strong grasp on present and future customer retention is critical to having a strong grasp on the overall health of a business, especially in edtech.
So what’s an early-stage startup without a lot of retention data to do? Maybe you just turned on monetization, or switched to a monthly subscription model, or are experimenting with a new channel or geography. How do you know what retention will look like months or years from now? And if you don’t know, how can you hope to accurately calculate LTV?
Often, companies circumvent this question entirely by taking the inverse of churn to yield a “customer lifetime,” typically expressed in months. For example, if five percent of customers churned in a given month, customer lifetime would be 20 months (= 1/0.05). Multiply this number by monthly contribution margin, and in theory you should have LTV.
While this method is quick and easy, it is critically lacking in nuance. By compressing all customer behavior into a single number, such a “point-in-time” churn metric fails to account for customer heterogeneity. To wit, most customers churn early on in their lifecycle, while a smaller core sticks around much longer. For a growing company, churn systematically overvalues the former group and undervalues the latter group.
Furthermore, the inverse churn method fails to account for heterogeneity across cohorts. Early customers may be loyal evangelists who hardly churn; conversely, later cohorts may retain at higher rates due to product enhancements and burgeoning network effects. A single number cannot hope to capture this variability and evolution.
Cohort analysis solves these problems by breaking customers into starting cohorts and tracking each cohort’s retention over time. This type of analysis both captures the aforementioned “high early churn, low later churn” dynamic and also illustrates how retention is evolving across cohorts. Cohort analysis outputs average customer retention as a function of time, which can be multiplied by contribution margin and then summed across a predetermined period, typically 24 or 36 months, to yield the canonical two and three-year LTVs so coveted in VC pitch decks.
Unfortunately, this brings us back to our original dilemma: What if you don’t have 24 months’ worth of cohort retention data? You could try to fit a traditional trendline to the existing data, assuming customer retention in the long run behaves linearly, quadratically, or even exponentially. But there’s no logical reason why retention curves would behave as such, and indeed, such regressions tend not to fit historical or future data very well at all.
Enter the shifted beta geometric (sBG) model (Fader & Hardie, 2007). By making a few simple and justifiable assumptions about customer behavior (including, critically, that customers exhibit heterogeneous churn probabilities) the sBG model yields a curve that fits historical data like a glove and has been proven to be an accurate predictor of future retention as well.
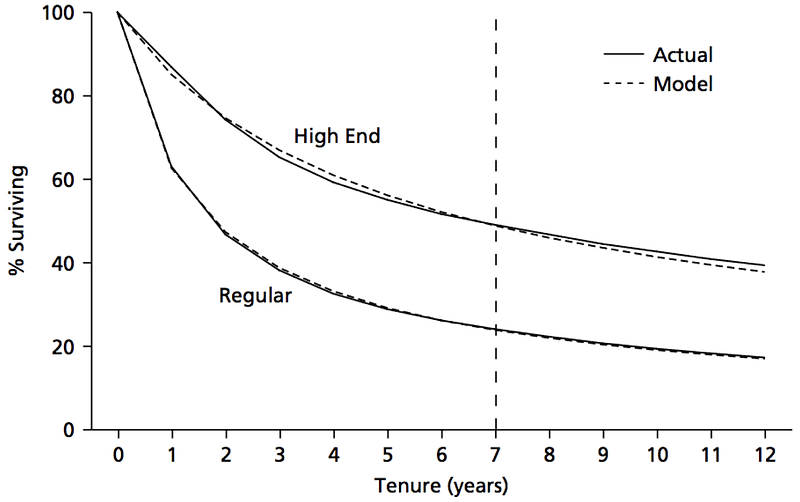
The robustness of the sBG model can be seen in the plot below taken from the Fader & Hardie paper, which overlays the predictions of the model (dashed line) on actual observed customer retention data (solid line) for an unspecified subscription business. The model is sensitive enough to output two distinct retention curves for two distinct customer types, “Regular” and “High End,” with the latter curve accurately reflecting that type’s lower churn probabilities.
But does the sBG model actually work for a “real” tech startup?
Reach portfolio company Lingokids, an early childhood English learning app, provides an illustrative example. After switching from an annual subscription model to a monthly subscription model, CEO Cristobal Viedma needed a way to forecast customer retention for both cashflow planning purposes, as well as to assess whether the switch to monthly had actually improved unit economics as hoped.
After scouring the VC and entrepreneurship communities, Cristobal came across the Fader & Hardie paper linked above. Putting on his engineering hat, he built an Excel model implementing the simple instructions laid out in Appendix B of that paper, input Lingokids’ monthly retention data to date, ran Solver, et voilà — the resulting retention predictions fit the historical data so perfectly that most of it was hidden under the output curve, exactly like the plot above. From there, Cristobal and his team were able to use the projections across functional areas ranging from product, to growth, to finance. Lingokids continues to utilize the sBG model to this day; indeed, Cristobal was the one who introduced us to the model and advocated for its use in retention forecasting.
As we’ve now seen, understanding customer retention is of paramount importance almost from the moment a business has customers. Cohort analysis is well known and one of the most useful tools in the retention analyst’s toolkit, but the sBG model is the add-on that superpowers that tool. Give it a try, and let us know how it works for you.