Revisiting Retention: How to Analyze and Benchmark Marketplace Businesses

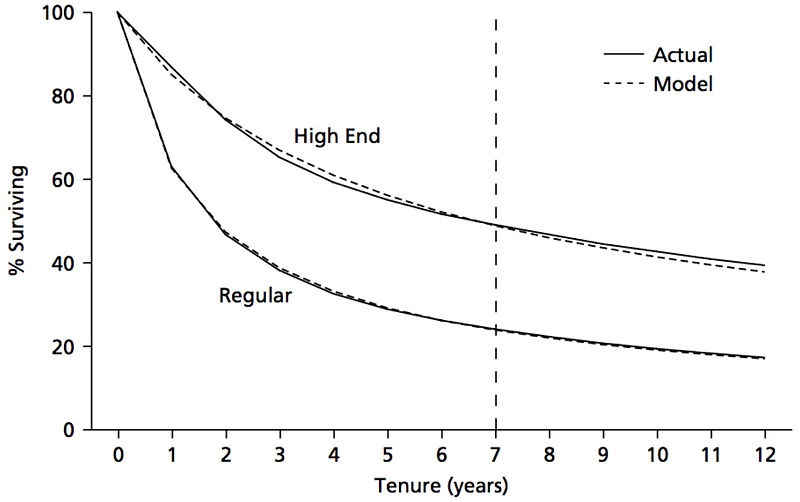
A few years ago I wrote an article extolling the virtues of cohort retention analysis for subscription businesses and describing an obscure but powerful method for forecasting retention based on just a few data points. I’m assuming that if you’re here, you’re already a disciple of cohort retention analysis.
I want to do another deep dive on retention, but more tactical this time, and focusing on marketplaces and other transactional businesses. Retention is an even stronger signal of product-market fit for these types of models because each transaction is opt-in; you don’t benefit from customers’ inertia or forgetfulness, the way you might with subscription models where the customers’ credit card automatically gets charged month after month.
It is especially important for edtech companies to pay close attention to retention, since most products and services address a narrow slice of a learner’s life — elementary school, college, career transitions, etc. — so they need to maximize retention while their customers are still part of their addressable market.
With that said, let’s begin! For the following exercises, you will need:
- monthly gross merchandise value (GMV) data
- active users data
- monthly sales & marketing spend data
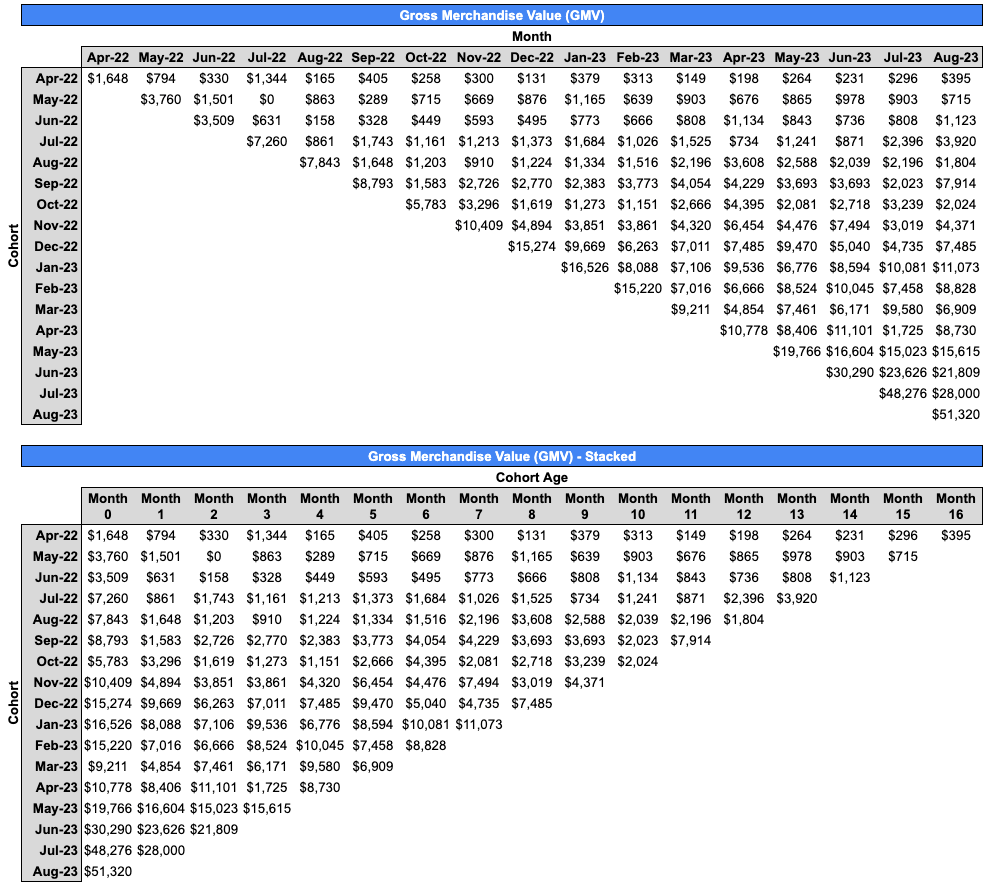
Let’s start with the GMV data below. This is from a real consumer marketplace in the Reach portfolio, but the data has been obfuscated. The second table shows the same data, but with all the rows “stacked” against the first column so that we can compare across cohorts on an apples-to-apples basis. (We’ll see why this is important later.)
There are a couple analyses we can immediately run on the GMV data:
- First, summing across each row, then dividing by cohort size, yields lifetime GMV (LTGMV) for that cohort.
- Multiplying LTGMV by average take rate and gross margin percent (in this example, 40% and 91% respectively) yields lifetime value (LTV) for that cohort.
- If the data is available, we can also take sales and marketing dollars spent to acquire a given cohort and divide by cohort size (“N” in the table below) to yield customer acquisition costs (CAC) for that cohort. Dividing the LTV by CAC yields the LTV/CAC ratio for that cohort.
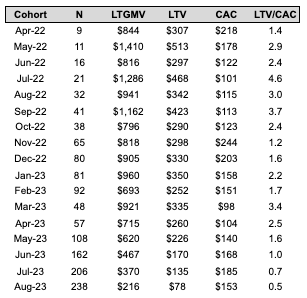
Importantly, these calculations yield real, historical customer LTVs and LTV/CAC ratios that we can “take to the bank” when thinking about unit economics, cash planning, and reporting (though keep in mind that it will be conservative since it doesn’t account for future spend). Contrast this with the usual method for calculating LTV — monthly gross margin per user divided by monthly churn — which amounts to a crude and rarely accurate prediction of future customer behavior.
In the table above, we can see that for older cohorts that have had time to “bake,” the typical customer has historically represented about $300-400 of LTV to our business. Notably, we can use historical LTV data to set future CAC targets. For example, if we’re targeting a 5x LTV/CAC ratio, we should aim for a CAC of $60-80, which means we need to decrease our current CAC by about half. We can do this through a higher share of organic acquisition, more efficient paid campaigns, or both.
Next, we can transform stacked GMV spend into net GMV retention by dividing each month’s spend by Month 0 spend for that cohort. That yields the following net GMV retention table, which I’ve conditional formatted for easy visual reference. This analysis gives us arguably one of the most important snapshots of the health of our transactional business.

In this view, scanning down a given column lets us see the evolution of net GMV retention across cohorts, on an apples-to-apples basis. Ideally, we should see retention ticking up cohort-over-cohort as we make efforts to improve our product/UX; broaden our offerings; hone our ICP and marketing channels; and, for marketplaces, increase liquidity. In the table above, we can indeed see that most columns improve from older cohorts to newer cohorts, as indicated by a shift from red cells to yellow/green cells.
We may also flag discontinuities. For example, in the table above, Month 1 retention is sharply higher for the October 2022 cohort and beyond, compared to prior cohorts. This should spark our curiosity: what did we do differently internally, or what happened externally, to cause the discontinuity? What can we learn and apply to future cohorts?
In this case, starting in October 2022, the company began focusing acquisition on customer personas that it hypothesized were a better fit for the product, and the effort paid off. (Keep in mind that some of the discontinuities may be statistical noise, but this is less likely with larger cohorts or persistent discontinuities.)
Another useful transformation is to divide each raw GMV number by its underlying number of active users to yield GMV per active user (GPAU), which we can further transform into GPAU retention using the same method as above. In this context, “active user” refers to a new or retained user who transacted that month.
For example, if a cohort spent $1000 in a given month and 10 users out of that cohort transacted that month, then GPAU would be $100. This analysis helps us understand customer behavior at a granular level: not just how aggregate cohort behavior is evolving over time, but whether that evolution is driven by retained users spending more (or less) than they initially did.
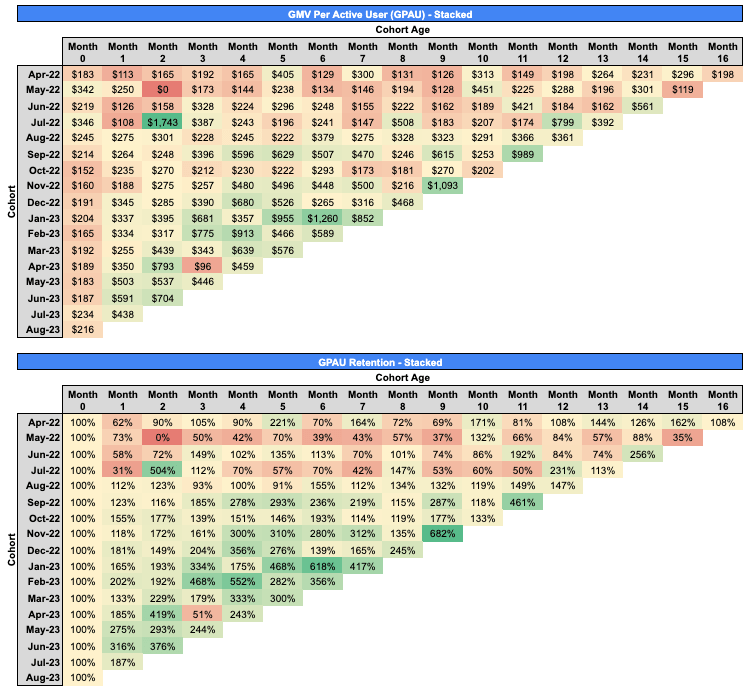
Scanning down a given column lets us see the evolution of GPAU and GPAU retention across cohorts, on an apples to apples basis. Ideally, we should see these metrics ticking up cohort-over-cohort for the same reasons described above: improvements to product/UX; broadening our offerings; better targeting; and increased liquidity.
Indeed, we see in this case that while users have consistently spent $150-200 in Month 0 over the last year, the users in more recent cohorts who retain in Month 1 onward are spending more (in absolute dollar terms and as a percent of Month 0 spend) than comparable users in older cohorts. In fact, some retained users in recent cohorts are spending many multiples of their Month 0 spend in subsequent months. We should try very hard to understand who these users are, why they not only retain but spend increasing amounts with us over time, and how to find more of them.
Lastly, returning to stacked GMV data (the first table set), we can divide the sum of each column by the corresponding sum in the Month 0 column to yield weighted average net GMV retention. For example, to calculate weighted average net GMV retention for Month 15, divide the sum of the two data points in that column ($296 + $715) by the the sum of the two corresponding data points in the Month 0 column ($1,648 + $3,760), yielding 19%.
This analysis allows us to compare ourselves against common net GMV retention benchmarks, which helps us understand the health of our business aggregated across cohorts (thus smoothing out statistical noise), and how a future investor might evaluate us relative to similar business models.

These benchmarks from a16z show that the average marketplace in their dataset achieves Month 1, Month 3, Month 6, and Month 12 demand-side retention of 66%, 57%, 50%, and 30%, respectively; it appears our business has some work to do to achieve and surpass these; though we can be comforted that our recent cohorts are closer to the mark, and still showing signs of improvement.
From forecasting unit economics, to measuring ROI on growth and efficiency initiatives, to honing your ideal customer profile and understanding how you stack up against similar businesses, there are few exercises that generate more actionable insights for your business than cohort retention analysis. While this article only scratches the surface, I hope it gives you a starting point to incorporate this type of analysis into your regular management practice.
Read the Latest
News and Insights